UNIT 2: Circular Flow, GDP, Real GDP, Nominal GDP, Employment, Unemployment, Natural Rate of Unemployment , Inflation Types, CPI and Inflation over time, The GDP Deflator and it uses
January 27, 2016
Circular Flow Diagram:
- It represents the transactions in a economy.
Product Market:
- The place where goods and services are produced by businesses.
Factor Market:
- The place where households sell resources and businesses buy resources.
Firms:
- An organization that produces goods and services for sale.
Household:
- A person or a group of people that share their income.
- They sell the factors of production (land, labor, capital (physical & human), entrepreneurship) to businesses.

January 28, 2016
UNIT 2: GDP, Real GDP, and Nominal GDP
Gross Domestic Product (GDP):
- The total market value of all final goods and services that is produced withing a country's borders in a given year.
- Every country has its own GDP.
Gross National Product (GNP):
- The total market value of all final goods and services by citizens of that country on its land or foreign land.
- Every country has its own GNP.
Included in GDP:
C - Personal Consumption Expenditure (65%)
Ig - Gross Private Domestic Investment (17%)
- New factory equipment
- Factor equipment maintenance
- Construction of housing
- Unsold inventory of products built in a year
G - Government Spending (20%)
Xn - Net Exports (-2%)
- (Exports - Imports)
What's NOT included in GDP:
1.) Intermediate goods
- Goods that require further processing before they are ready for final use.
- Trying to avoid double goods
- It fluctuates, it could crash, it doesn't involve a good or service; not durable.
- EX: Selling drugs
- EX: Unreported tips
- Public: (Social Security, welfare, etc.)
- Private: (Scholarships)
7.) Non-market activities
- Volunteering
- Baby-sitting
- Any work that you perform for yourself
February 1, 2016

2.) Expenditure Approach
UNIT 2: Calculating the GDP: Expenditures and Income Approach
2 Ways To Calculate GDP:
1.) Income Approach
- Add up all the income that resulted from selling all final goods and services produced in a given year.
- Not used so much (people lie about their income)
- Formula: GDP= w + r + i + p + statistical adjustments

2.) Expenditure Approach
- Add up all the spending on final goods and services produced in a given year.
- Formula: GDP= C + Ig + G + Xn

Compensation of Employees:
- Wages and salaries
- Wages and salary supplements (Pensions, health insurance, welfare)
Rents:
- Income received by the households and businesses that supply property resources
- Ex: Tenant to landlords (monthly payments)
Interests:
- Money paid to suppliers of loans
Proprietors Income:
- Comes sole proprietors and partnerships
- Sole Proprietors: you own your business (entrepreneurs)
Corporate Profits:
- Could include dividends, corporate income taxes, undistributed corporate profits
Statistical Adjustments:
- Indirect business taxes
- Consumption of fixed capital (depreciation)
- Net foreign factor payment
Budget:
- Formula: Government purchases of goods & services + Government transfer payments - Government tax and fee collections
- + : deficit
- - : surplus
Trade:
- Formula: exports - imports
- + : surplus- : deficit
National Income:
- Formula:
- 1.) Compensation of employees + rent + interests income + proprietors income + corporate profits
- 2.) GDP - interest business taxes - depreciation - net foreign factor payments
Disposable Personal Income:
- Formula: National income - personal household taxes + government transfer payments
Net Domestic Product (NDP):
- Formula: GDP - depreciation
Net National Product (NNP):
- Formula: GNP - depreciation
- GNP = GDP + net foreign factor payment
February 2, 2016

Transferable Skills:
A person who has a skill set but bad experience.

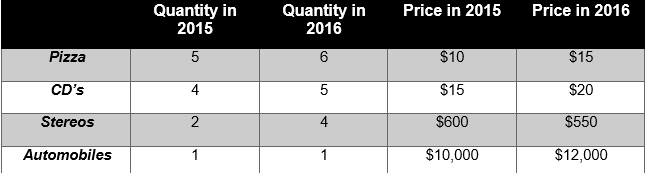
Nominal GDP:
- It is the value of output produced in current year prices
- Formula: Output= Quantity
Real GDP:
- It is the value of output produced in constant base year prices
- Adjusted for inflation
- Real GDP can increase from year to year only if quantity increases (used for economic growth)
- Formula: Price × Quantity
- If you wanted to measure economic growth, use real GDP.
- If you wanted to measure inflation, use nominal GDP.
- In the base years: nominal GDP = real GDP
- In years after the base year, nominal GDP will exceed real GDP.
- In years before the base year, real GDP will exceed nominal GDP.
GDP Deflator:
- Price index used to adjust from nominal to real GDP
- Formula:

- In the base year, the GDP deflator equals 100
- For years after the base year, the GDP deflator is greater than 100.
- For years before the base years, the GDP deflator is less than 100.
Consumer Price Index (CPI):
- The most commonly used measurement of inflation.
- It measure the cost of a market basket of goods fro a typrical urban American fmaily.
- Formula:


Inflation:
- Formula:

February 3, 2016
Nominal Interest Rate:
- It is NOT adjusted for inflation but your real interest rate is (anticipated).
- Percentage increase in money you pay the lender for the use of money that you borrowed.
- Formula: Real rate of interest + inflation premium
Real Interest Rate:
- It is adjusted for inflation (unanticipated)
- It is percentage increase in purchasing power the lender receives when the borrower pays the loan with interest
- Formula: Nominal interest rate - inflation = real interest rate
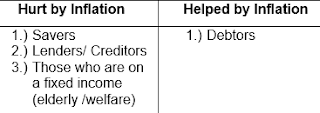
Unanticipated Inflation:

Cost of Living Adjustments (COLA):
- Automatic wage increases when inflation occurs.
February 4, 2016
Unemployment:
- It is failure to use available resources particularly labor to produce desired goods and services.
- Not having a job/working (obviously)
Labor force:
- Anybody above 16 years of age
- Able of willing to work
- Employed + Unemployed
Not in the Labor force:
- People in the military
- Homemakers
- Retired people
- Students (even if they work)
- Disabled people
- People in metal institutions
- People in jail/ prison
- Those who are not looking for work
Unemployed Rate:
- 4% to 5 = Full employment or Natural Rate of Unemployed (NRU)
How to calculate the Unemployment Rate:
Formula:
Transferable Skills:
A person who has a skill set but bad experience.
Types of Unemployment:
Frictional:
Frictional:
- People who are looking for a job
- Temporarily unemployed or between jobs
- Individuals with transferable skills
- Ex: High school or college graduates looking for job
- Ex: Individuals who leave their jobs in hope of finding better
Structural:
- Changes in the structure of the labor force makes some skills obsolete.
- These workers DO NOT have transferable skills
- Have to learn new skills to get job
- Ex: Space people after Obama closes down the space program -> Have to learn new skills to get another different job.
- Ex: VCR's
- Due to the time of the year and the nature of the job.
- Ex: School-bus drivers - only work when school is in
- Ex: Santa Clauses impersonators - only work during Christmas time
- Ex: Lifeguards - only work in the summers
- Ex: Construction workers - only work when there isn't any acclimate weather.
Cyclical:
- Unemployment that results from economics downturns, such as a recession.
- As demand for goods and services falls, demand for labor falls and workers are laid off.
- Ex: Closing of Macy's and Wal-Marts
- Ex: Recession: Oil industry
- Full employment means no cyclical unemployment
- 2 of the 4 Types of Unemployment are unavoidable: Structural & Frictional = (NRU)

February 5, 2016
GDP Gap:
- It is the amount by which actual GDP falls short of potential GDP.
Okun's Law:
- For every 1% in which the actual unemployment rate exceeds the natural rate of unemployed.
- GDP gap of about 2% occurs
- Ex: In 2011, the unemployment rate for Mexico is 7.4%. The NRU is 6%.
7.4 - 6 = 1.4
1.4 × 2= 2.8%
Gap: 2.8%
The Rule of 70:
- It is used to determine how many years it will take for a value to double given a particular annual growth rate
- Ex: If you put $20,000 in the bank and it earns a yearly interest of 7%, how many years will it take for your income to double?
- Formula: 70 ÷ interest rate
- 70 ÷ 7 = 10 years


